As a follow-up to my post about using Tracy as an instrumentation profiler for Swift apps on Windows, here’s a write-up of my experience with the Windows-native performance tools, Windows Performance Recorder (WPR) and Windows Performance Analyzer (WPA).
Getting the Tools
The tools are part of the Windows Performance Toolkit, and can be installed either via
- the Visual Studio Installer, or
- the Windows Assessment and Deployment Kit.
- Windows Performance Analyzer can also be obtained from the Microsoft Store.
As for the Swift toolchain, I am running a recent TheBrowserCompany Swift toolchain. The TBC toolchain is required to get full symbolication of the Swift runtime and core libraries. Note that a swift.org toolchain will not work (because there are no symbols available publicly).
Also, I am running on an Intel laptop here. When trying to launch Windows Performance Recorder on my Windows 11 ARM VM, it failed with an exception. Not sure if Windows ARM is simply not supported by the tools just yet.
Windows Performance Recorder (WPR)
Windows Performance Recorder is the tool to capture traces. Here’s what it looks like:
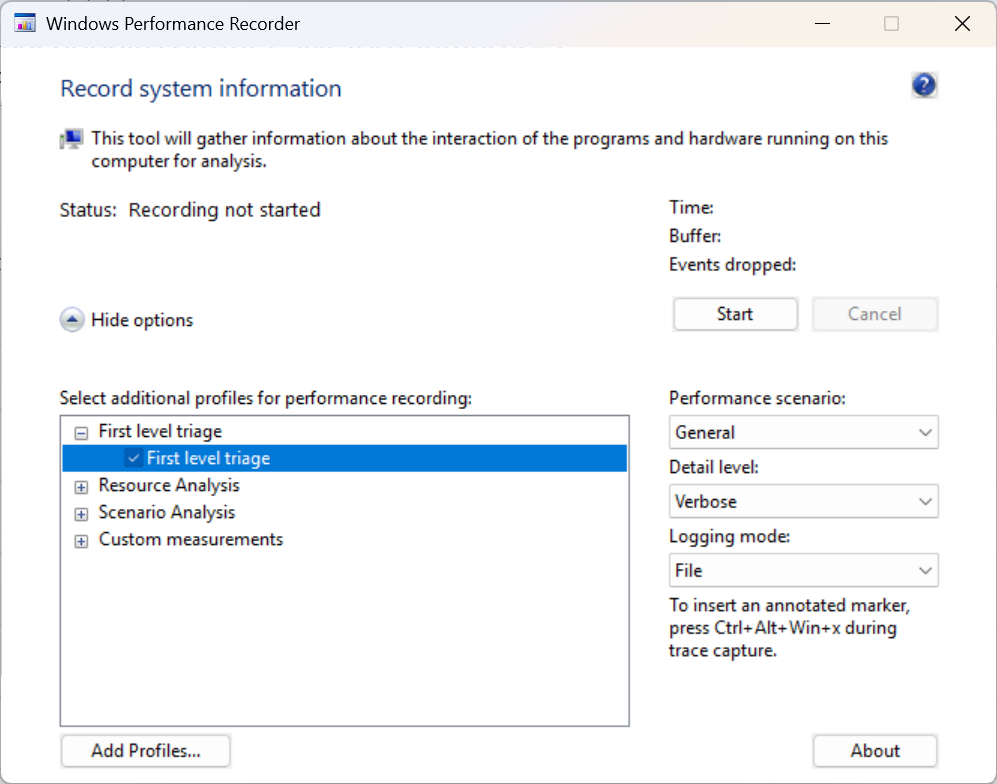
Pressing the Start button will start recording into an in-memory ring buffer (which means you can leave it running for hours without blowing up your system).
Then you run your app through the scenario you want to analyze, and press Save to save the captured trace:
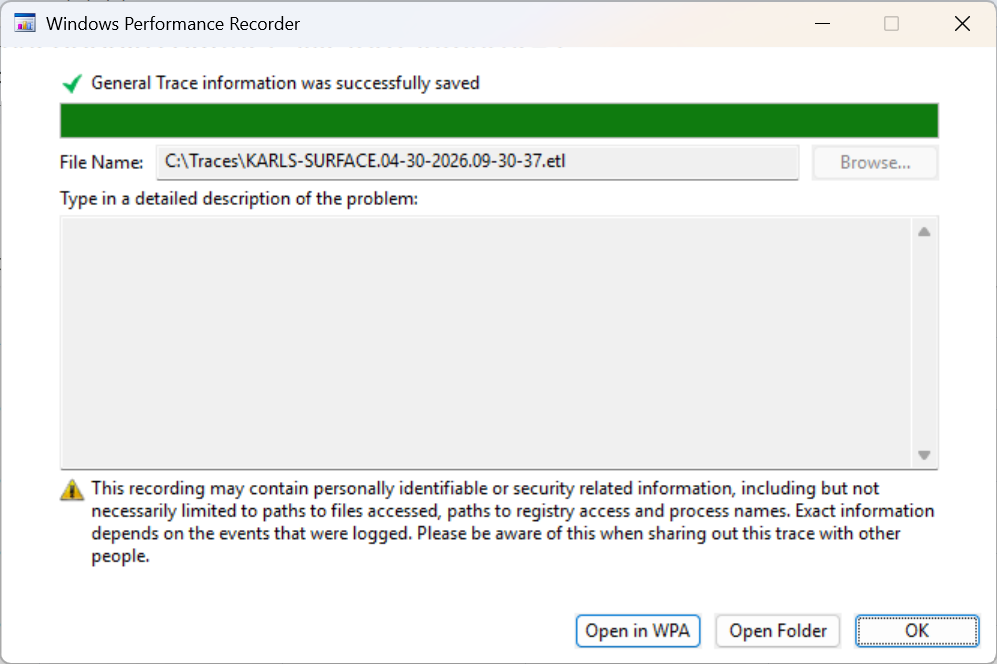
The “Open in WPA” button will load the trace straight into Windows Performance Analyzer.
For me, loading a trace captured with the default settings into WPA failed with an execption, however:
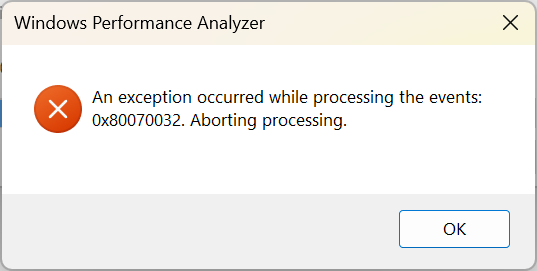
Consulting Codex on the matter, this means that WPA’s ETL parser hit an event it doesn’t know how to handle. To identify the offending events, I ran
PS C:\Traces> xperf -i .\ZoomIn.etl -o .\trace.txt
[1/2][\]  84.7%
Error:   EventSink {39cda801-59d8-472d-bc00-601a4150c4c4} returned HRESULT 0x80070032 on:
         Event#: 3601101  (T#0:#3601101)
         TimeStamp:   43359803, Process: 4960, Thread: 21376, Cpu:   0
         ProviderId: {a669021c-c450-4609-a035-5af59af4df18}
         EventDescriptor: 0x0096 0x0001 0x2a   0x01    0x00    0x05  0x0000000000020000
         UserDataLength: 133
Execute: ISession::ProcessEvents [0x80070032]
On which Codex has to say:
ProviderId … is the .NET Common Language Runtime ETW provider, so WPA/xperf is aborting on a CLR event. Microsoft’s CLR ETW docs list that GUID as the CLR runtime provider. 0x80070032 is ERROR_NOT_SUPPORTED, which in this context usually means “the parser doesn’t support this event schema/version.” Sources: CLR ETW events.
Since I am not interested in anything .NET for profiling my native app, my strategy was to build a custom recorder profile that doesn’t include any .NET events.
I did so by exporting a built-in profile to a file:
> wpr -profiles
> wpr -exportprofile GeneralProfile C:\Traces\GeneralProfile.wprp -filemode
and then asking Codex to remove the offending events. I then added my new custom profile into WPR through the “Add Profiles…” button:
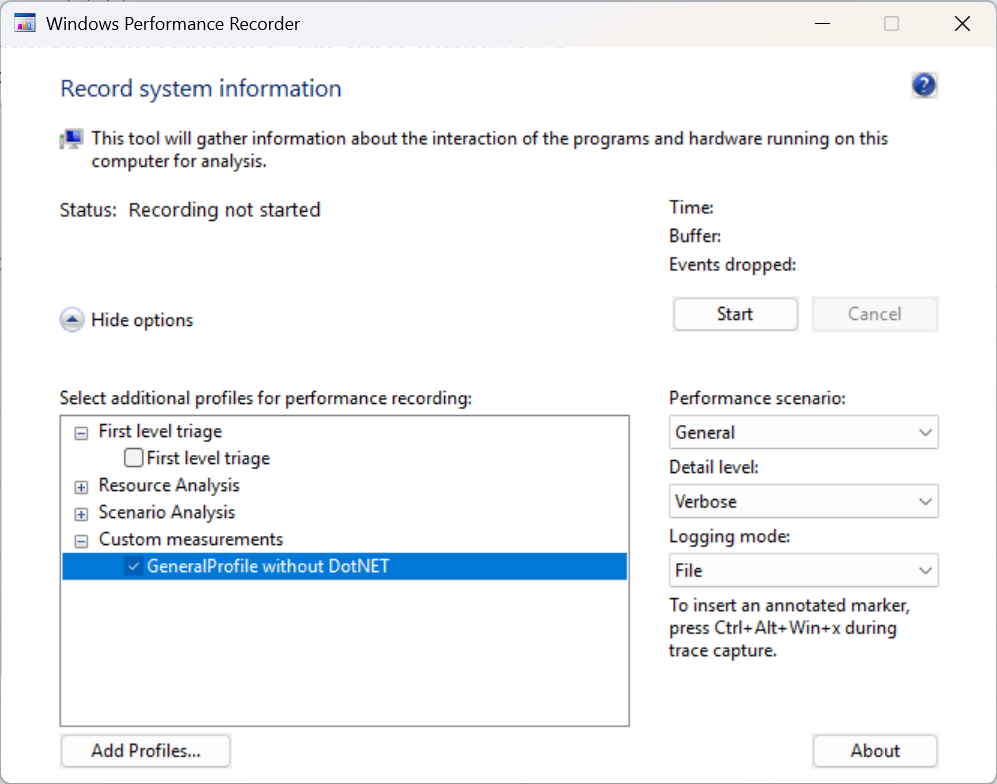
After that, newly captured traces loaded fine.
Windows Performance Analyzer (WPA)
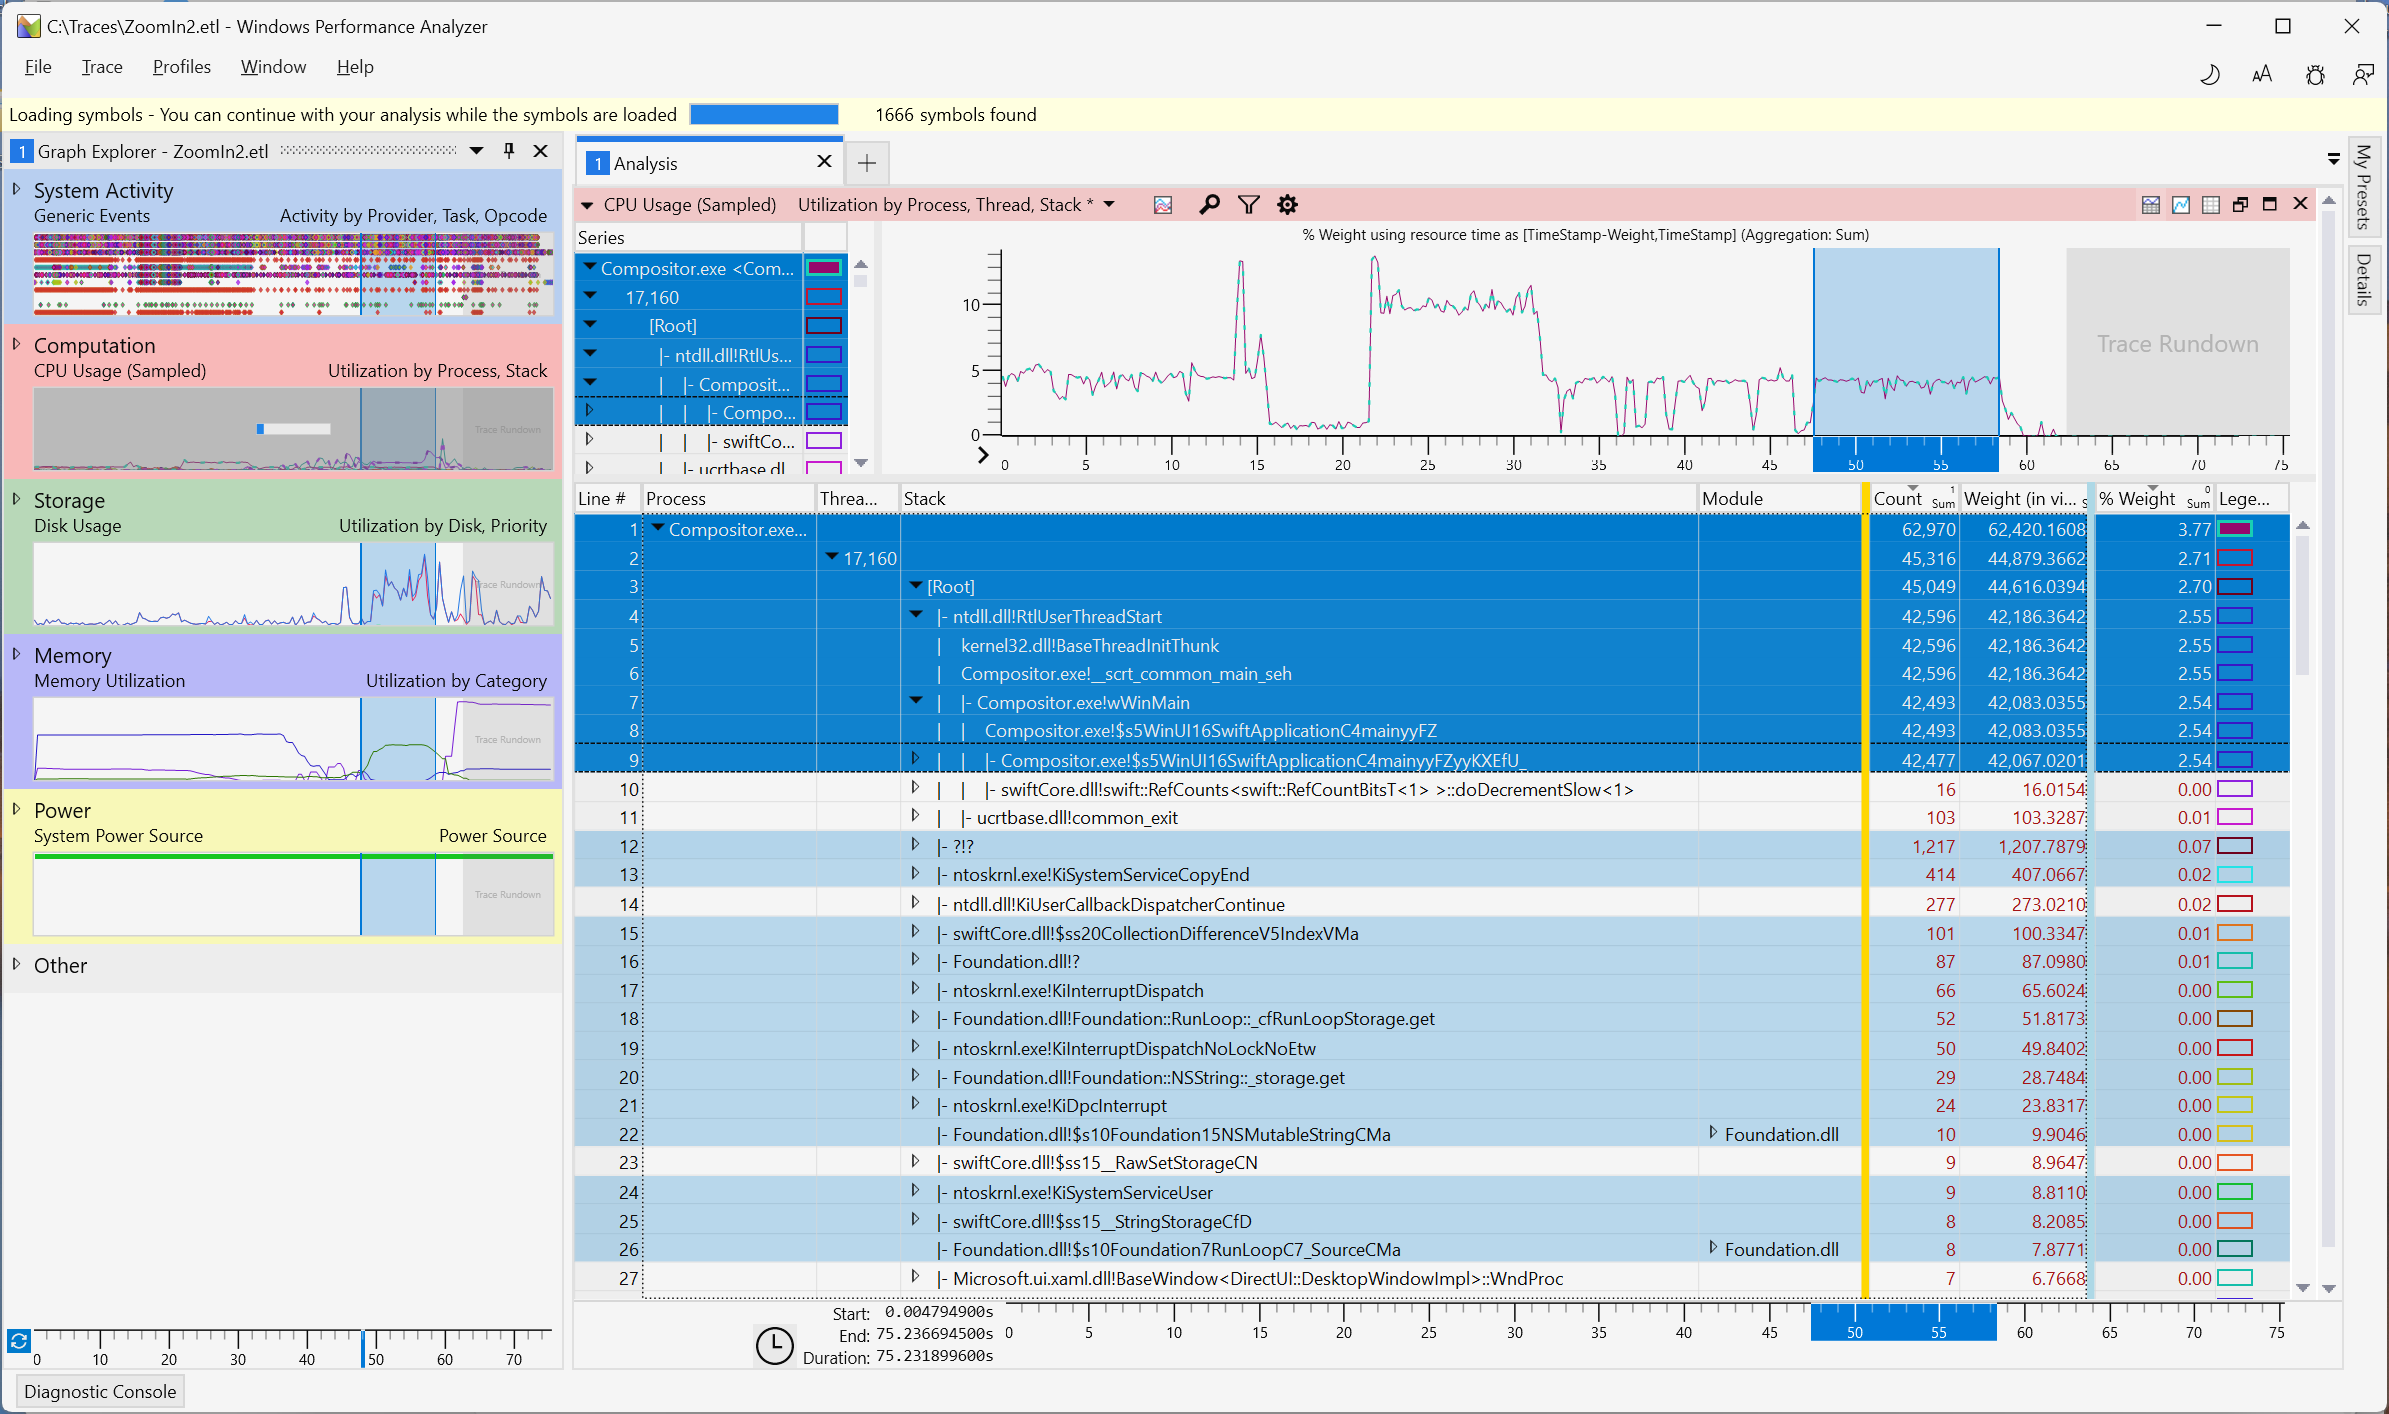
Here’s what the trace looks like in Windows Performance Analyzer:
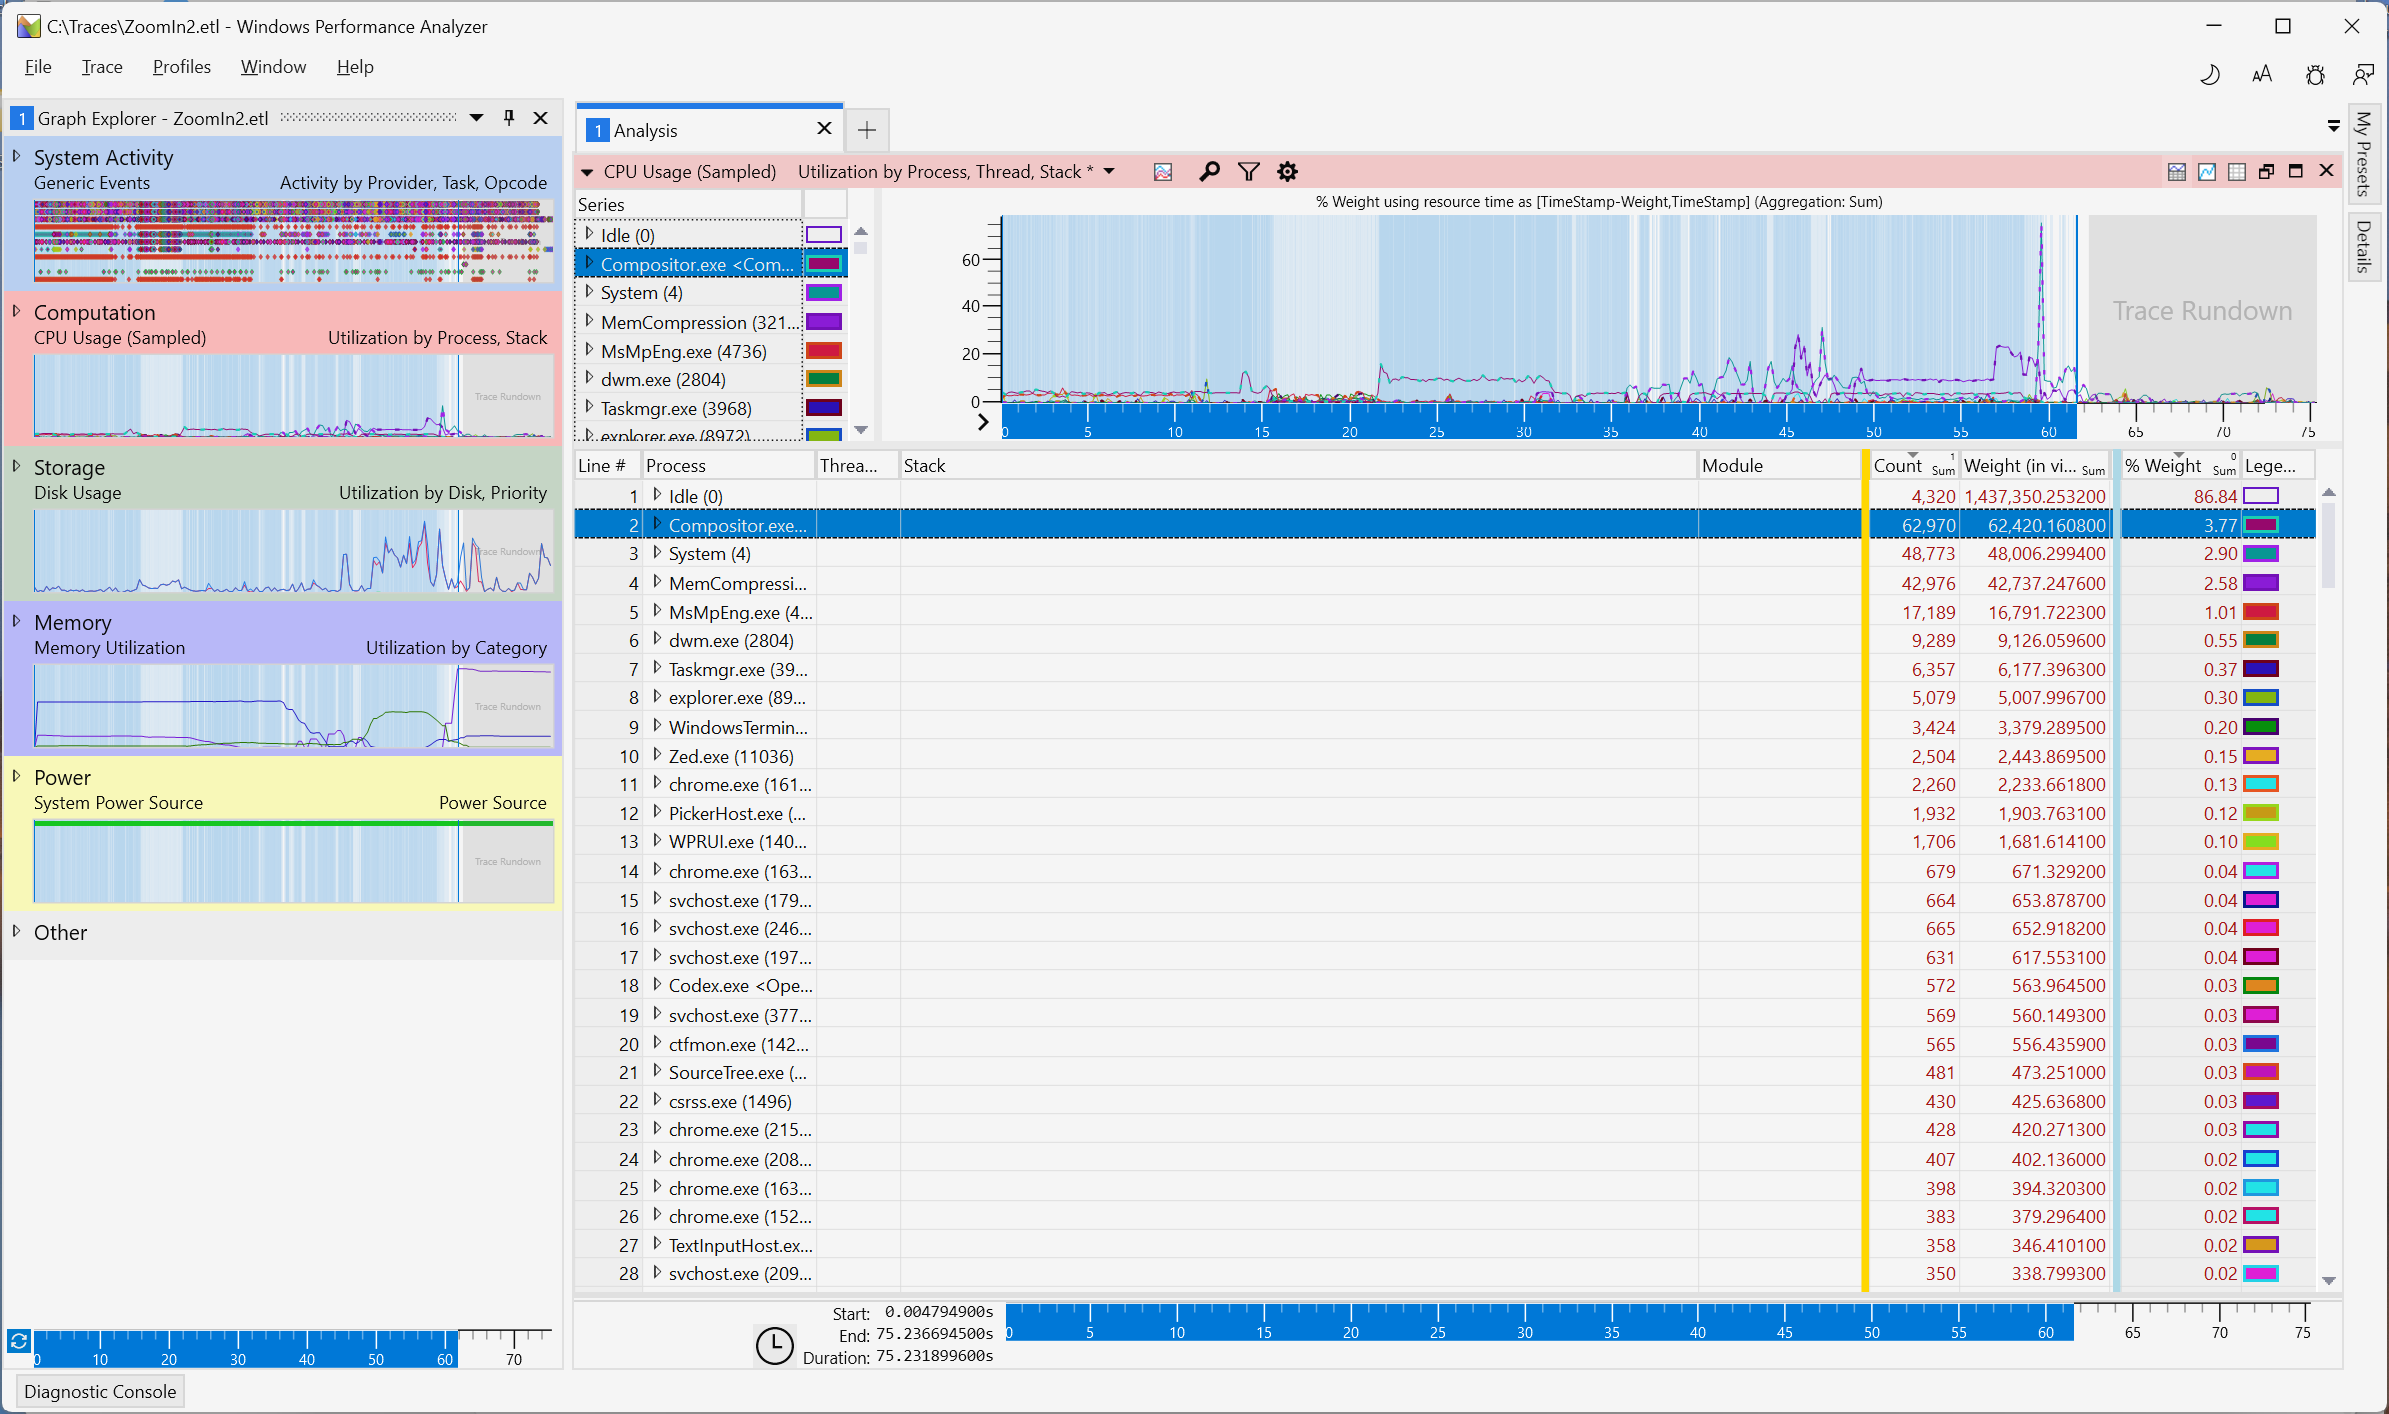
I dragged the “CPU Usage (Sampled)” chart from the Graph Explorer’s Computation section onto the Analysis window to get this view.
But before drilling into the trace, I configured the symbol paths:
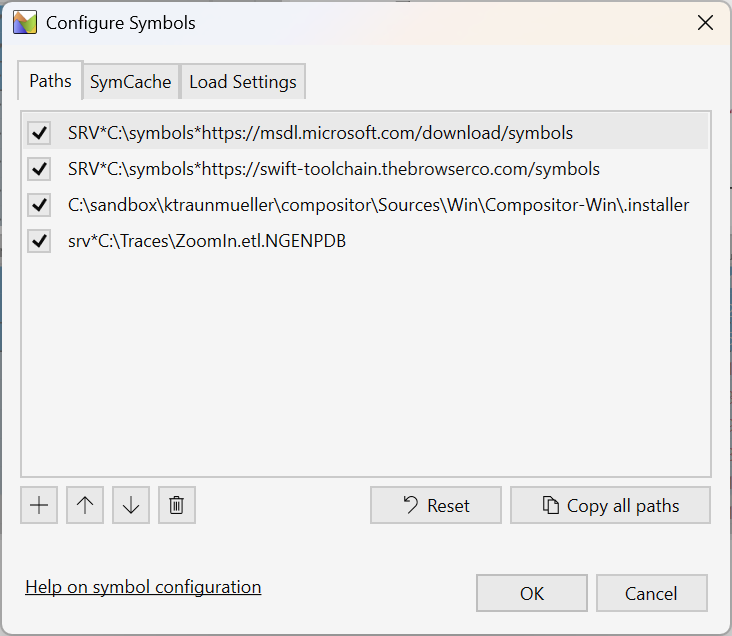
Note the second entry, below the Microsoft symbol server: this is a symbol server operated by The Browser Company that provides symbols for their Swift toolchain builds. That’s why I am using a TBC Swift toolchain – symbolication of the Swift runtime and core libraries will only work if the toolchain and symbols match.
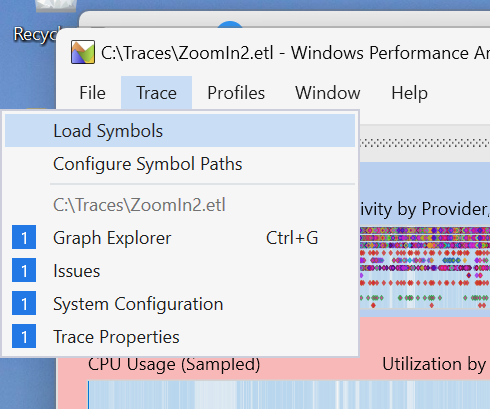
Once configured, check the “Load Symbols” menu to start loading symbols:
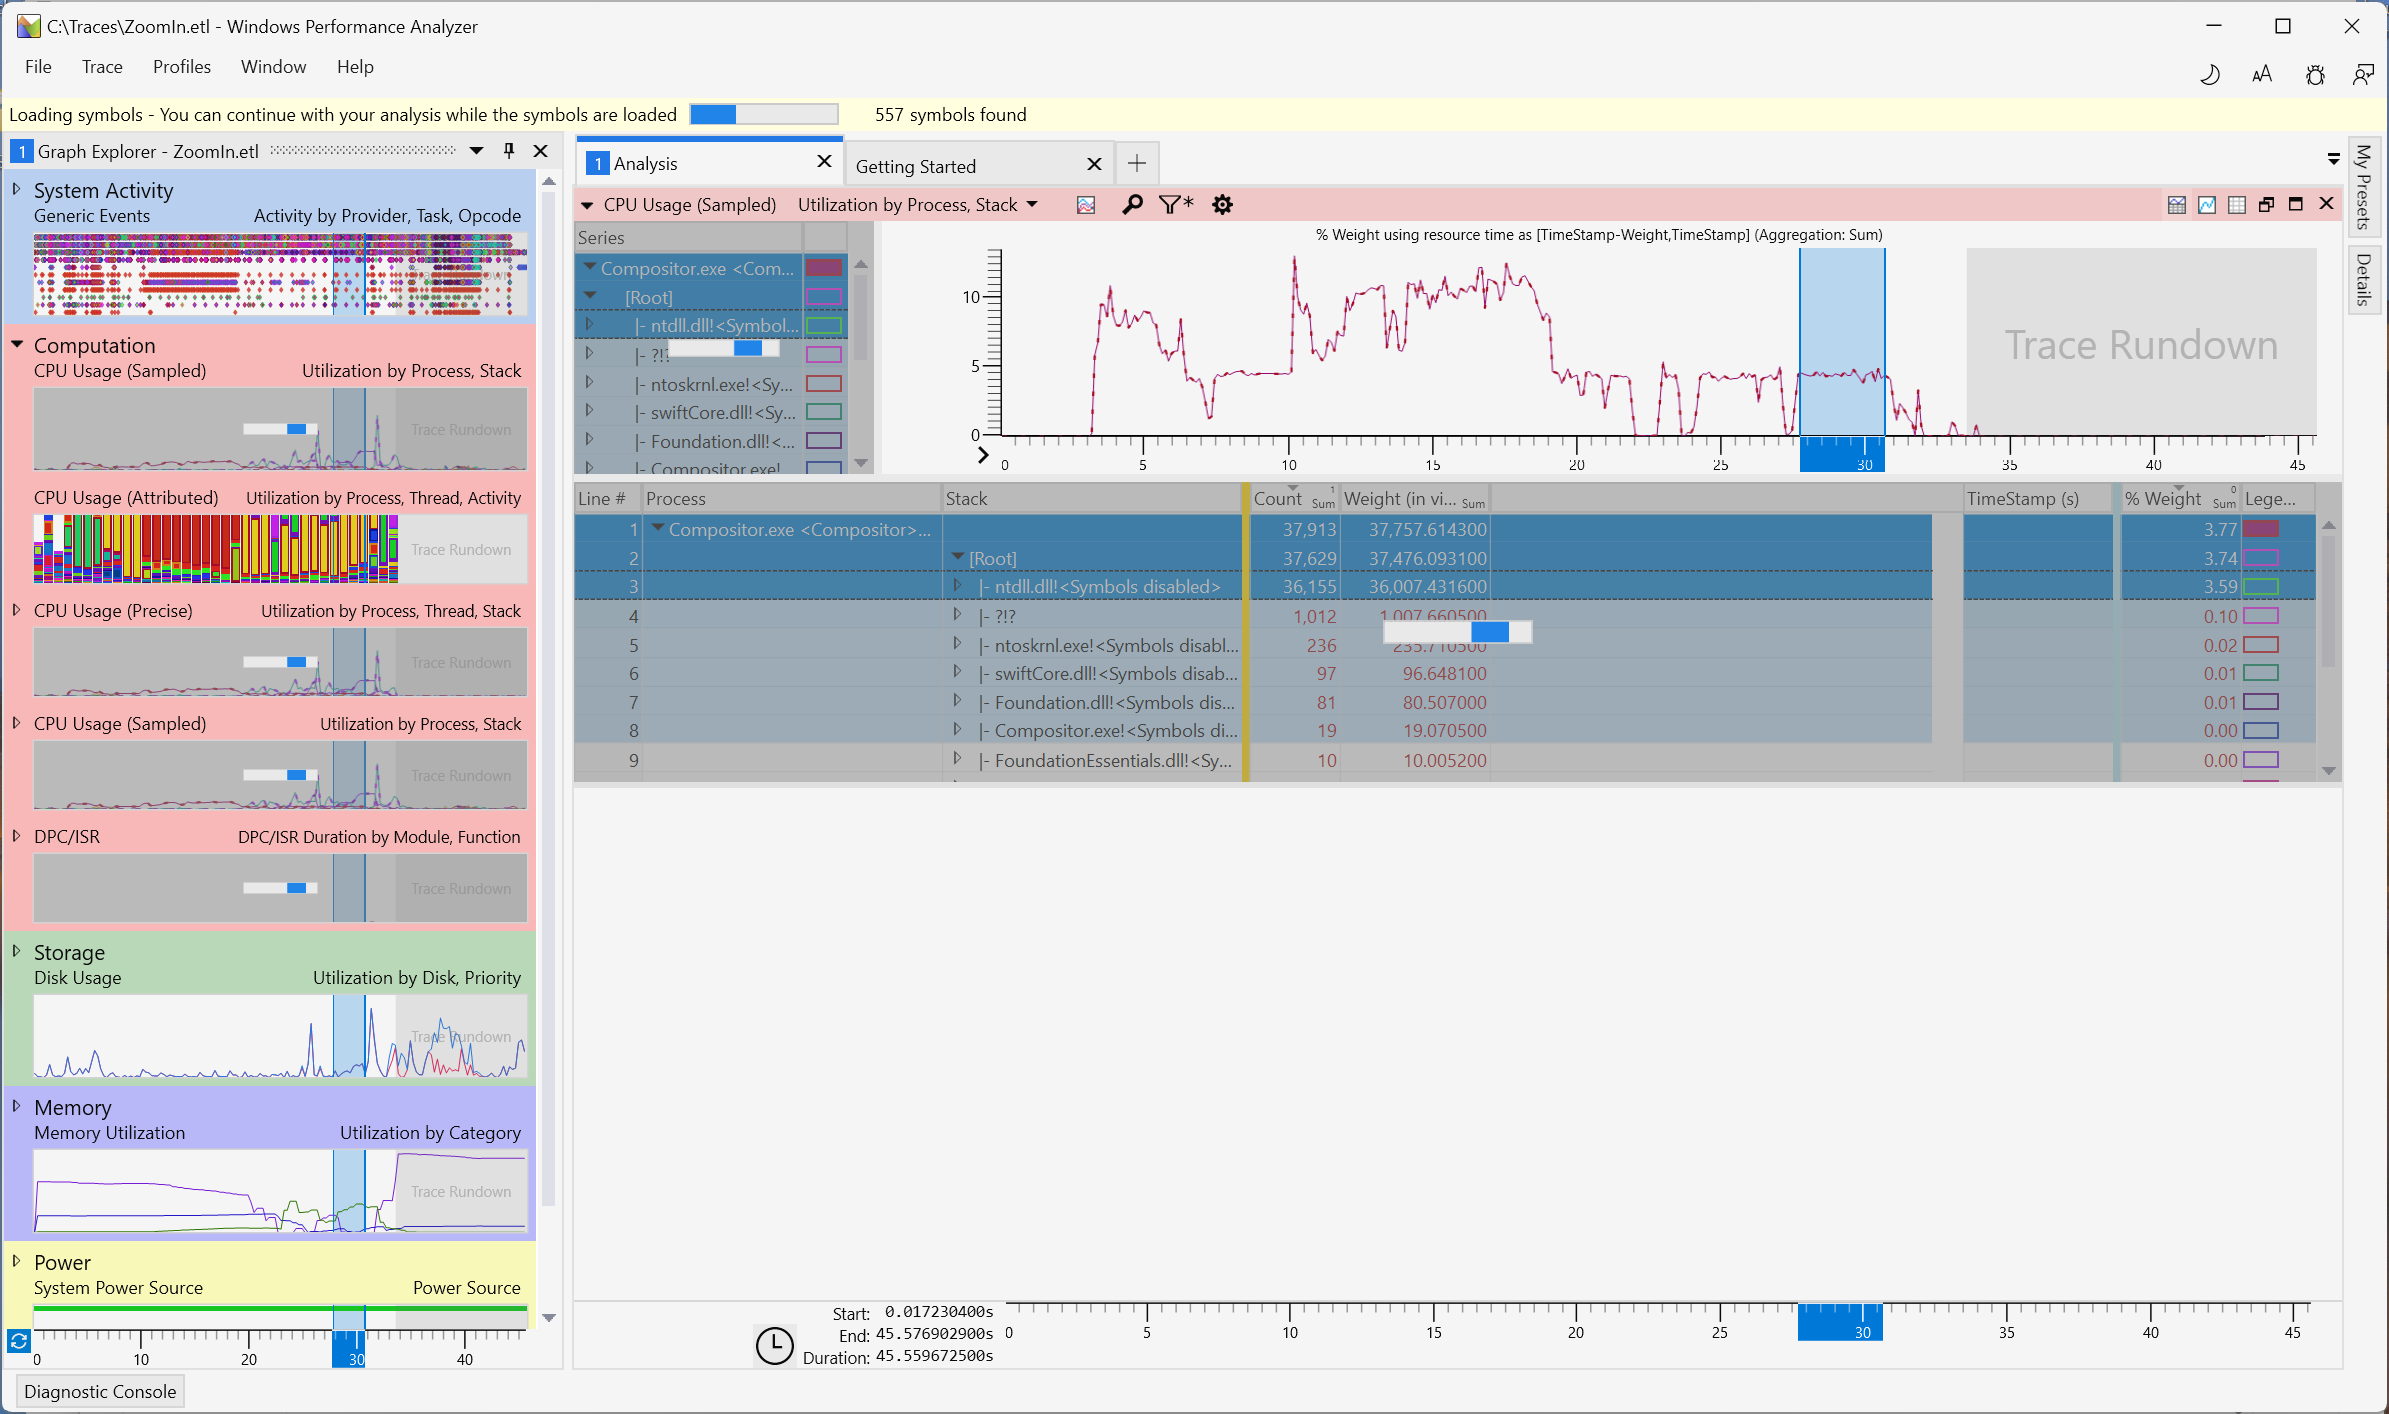
After that, WPA will start downloading symbols:
On the first run, this took several hours on my slow internet connection.
The symbols are cached (in C:\symbols and C:\symcache by default), so subsequent
runs will be a lot faster.
I presume that WinDbg will also be able to find and use the symbols from those paths, so full-fidelity debugging from Swift code down into Windows libraries should work after that as well (I still need to check this).
Note that the trace includes all processes running at the time of capture:
Since I am only interested in what’s happening in my app, I right-clicked the Compositor.exe process and chose “Filter to Selection” to focus on just my app:

The table below the chart is grouped by process, thread, and stack. The first thread appears to be the main thread (you can see the WinMain entry point), with the stacks sorted by weight.
I won’t go into any details here, and I am just learning how to use this myself. This blog looks like a good resource to learn more.
In my example, I want to analyze a certain user interaction – a simple action that should take no time at all hangs the app for a few seconds. That’s the marked region of the chart (you can right-click and select “Zoom” from the context menu to focus on just that region):
Wrapping Up
Ok, let’s leave it at that. As mentioned, I still need to learn how to use this myself. But I thought this might be worth sharing with other users of Swift on Windows.